by Jonathan Harrington, Florian Schiel, Mary Stevens
(viewed best with Google Chrome; if animations don not show, try reload of the page)
On this page you will find some demonstrations/results of Agent Based Modelling (ABM) experiments that we conducted in our lab. This material can help to understand the rather complicated experiments described in the publications listed below. It is not intended as a tutorial or introduction to the ABM method we are using at IPS Munich.
In this chapter we demonstrate the basic behavior of two groups of artificial agents in our ABM when they are equipped with similar or different token distributions in their respective memory. More specifically, we show the effect on the development of agent behavior, if the tokens stored in agent's memories have different distributions in the phonetic feature space. The basic hypothesis is that if an agent's memorized tokens have a wider distribution in space and/or the distribution is oriented towards the more compact distribution of another speaker or speaker group, this agent will adapt more in the direction of the other speaker than vice versa.
For detailed description and discussion of the ABM, please refer to:
Harrington J, Schiel F (2017): /u/-fronting and agent-based modelling - The relationship between the origin and spread of sound change. Language, Vol 93, No 2 (2017), pp. 414-445, doi:10.1353/lan.2017.0019.
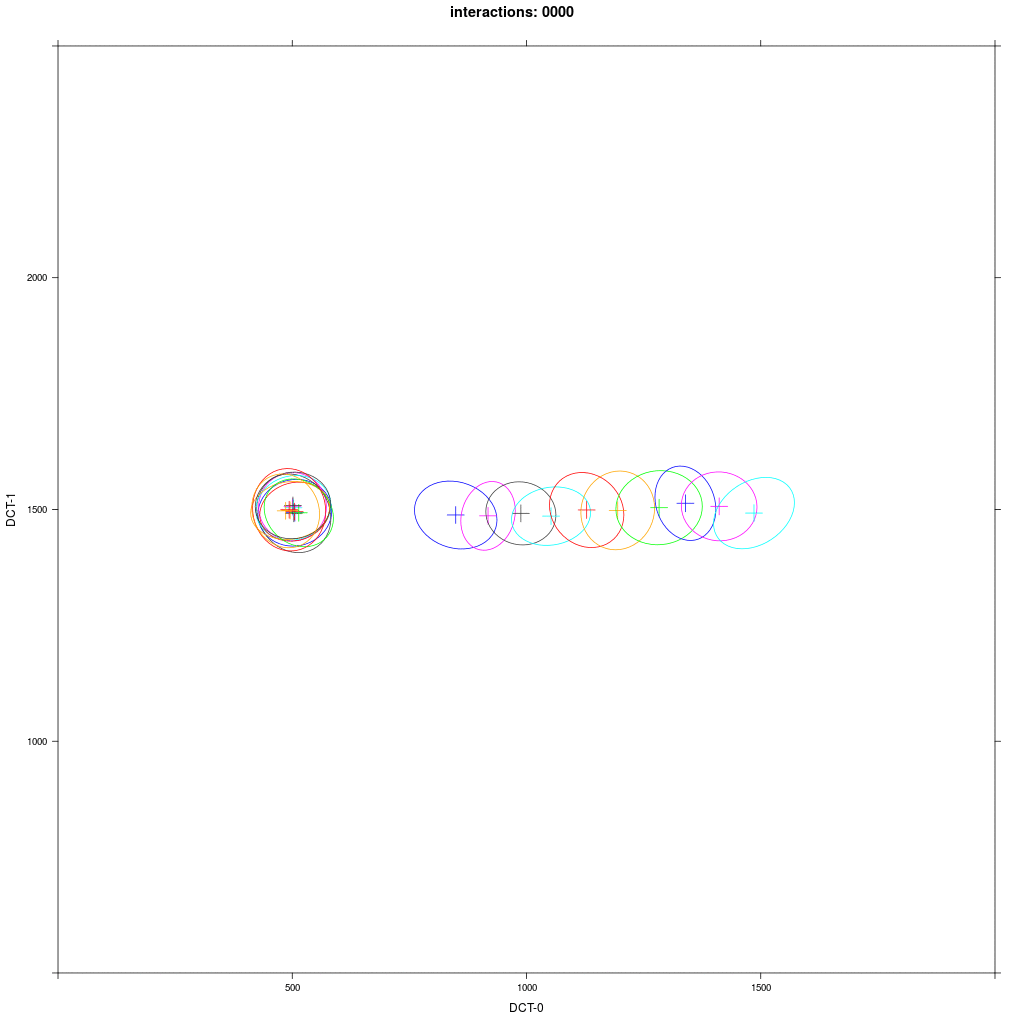
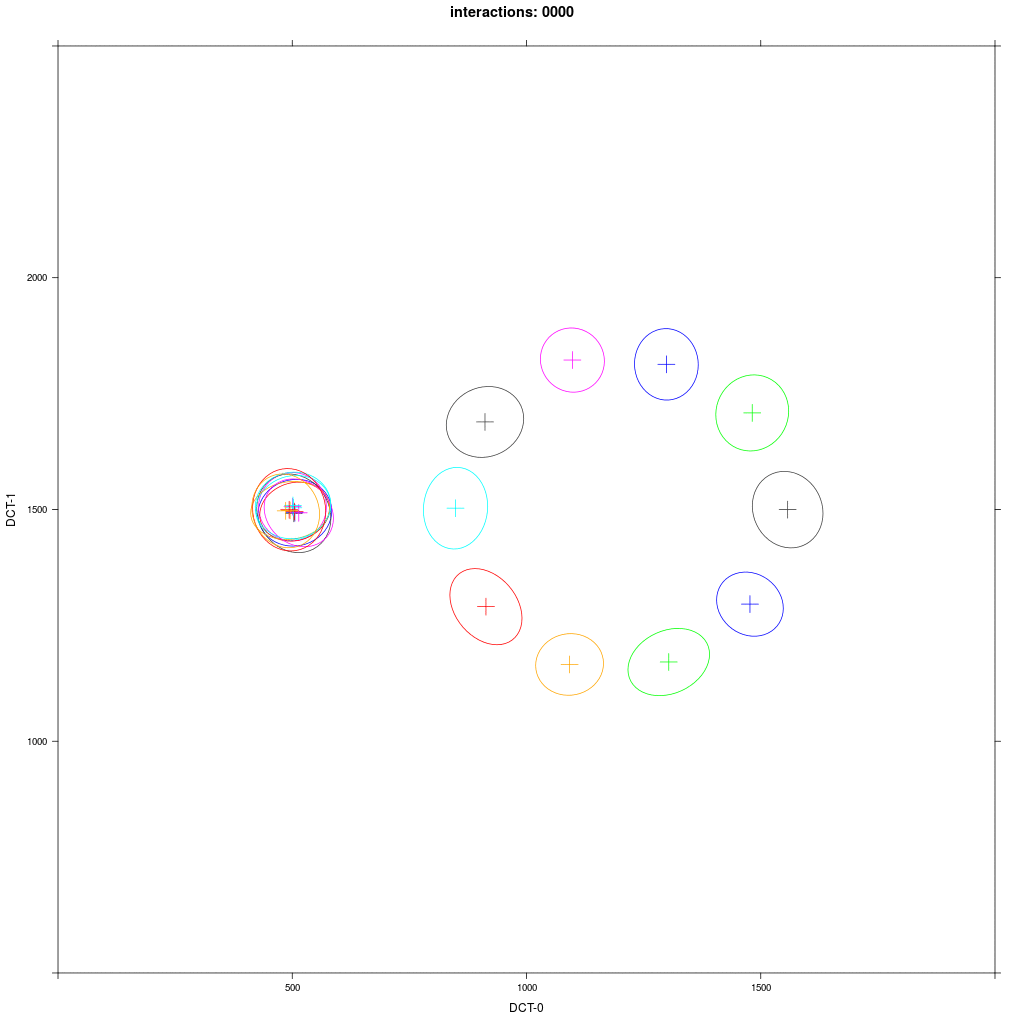
All following simulations are based on artificial agents and randomly generated artificial memory contents. Exchanged tokens and memory contents are distributed in a two-dimensional space, e.g. the first and second formant of a vowel. In most plots shown in the following distributions are plotted as 95% interval elipses in the two-dimensional space; speakers or speaker groups are indicated by different colors. The animations show the distributions of memory content of agents after every 400 random interactions, but not the distributions of exchanged tokens. Faded colors are the initial memory distributions, bright colors are the current distributions that change over the course of the ABM.
Details: There are always 20 agents in equal-sized groups; each agent speaks to all other agents with the same probability (except in the last experiment); there is only one exchanged word type with one phonological class; each agent has 50 tokens of this class memorized; each time a new token is memorized the oldest token is removed (constant memory size); the memorization rule is guided by the Mahalanobis distance to the class distribution (= method 2 in [1], Mahalanobis threshold is 2.5); splitting of phonological classes is not allowed.
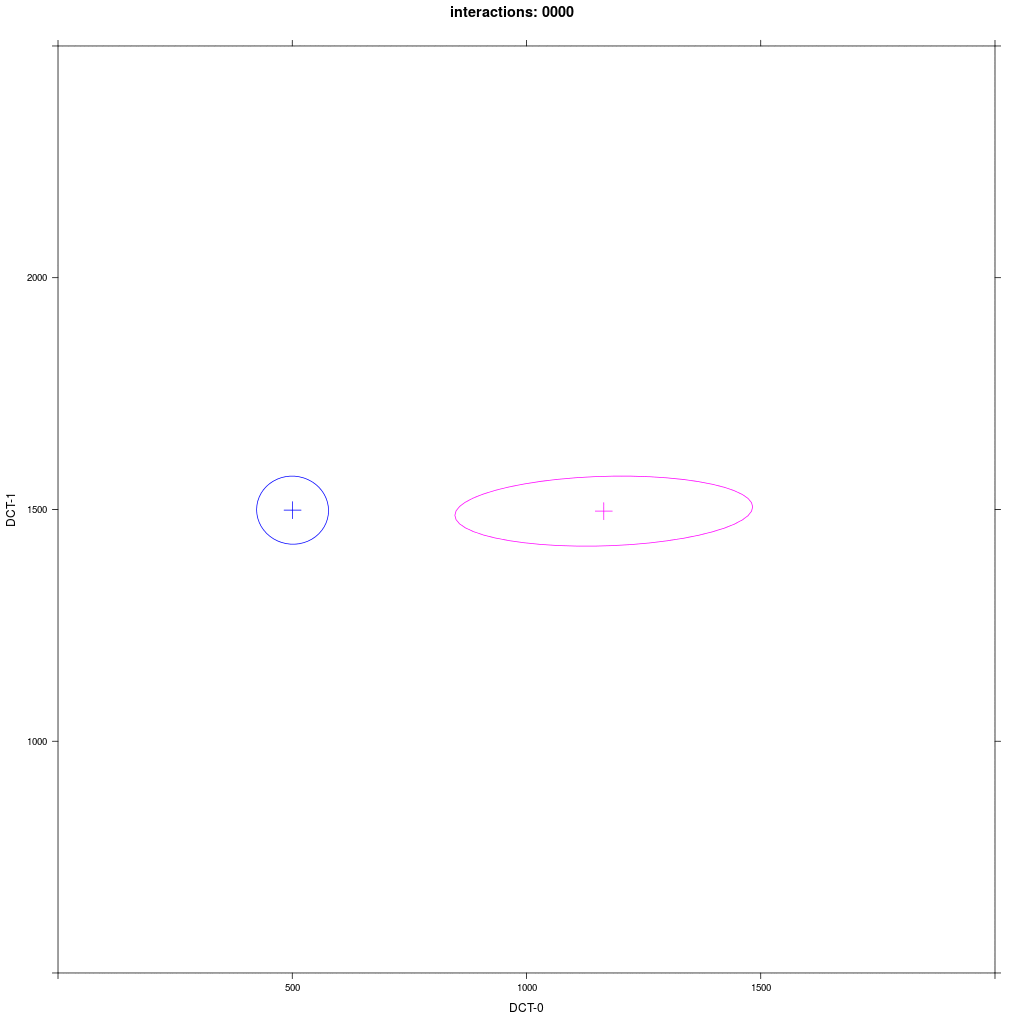
Two equal-sized agent groups exchange the same phonological segment /x/ in the same word;
agents of group A2 (blue) and C (magenta) all have circular distribution with a large SD around two different means.
Prediction: the memory tokens of A2 and C merge into a cluster in the middle between the two means (a la Trudgill).
Agents of group A1 have a narrow circular distribution with a small SD around the same mean,
while group B1 (magenta) have a different mean and a 5 times larger distribution in the direction of
the mean of A1 (the orthogonal SD is the same as in A1).
Prediction: the memory tokens of B1 move more in the direction of A1 than vice versa.
This asymmetric adaption effect is very reliable and happens every time we run the ABM.
Same as 1b but the distribution of group B1 is rotated by 90 degrees.
Prediction: the asymmetric adaption effect goes away, because there is no orientation towards A1.
There is no asymmetric adaption as in 1b. If we run this for a very long time, we'll see a mid-way merger as Trudgill would predict.
Same group A1 interact with group C (magenta) whose agents have the same mean (but different from A)
and a 5 times larger circular distribution than A1.
Prediction: we would expect the same reliable behavior as in the previous exp. 1b: C agents should always move more in direction of A1.
The effect is not as reliable as in experiment 1b (sometimes nothing happens), but if a movement takes place it results in a quite similar merged cluster as in 1b.
Group A1 from exp. 1b (small round) interacts with group E with a distribution that looks like B1 in exp. 1b (directed towards A1).
Prediction: we would expect the same reliable behavior as in the previous exp. 1b: E agents should always move more in direction of A1.
There are some difference to exp. 1b: the movement takes more interactions and the resulting merged cluster is much larger,
sometimes as large as the starting E distribution, and often the mean of the merged cluster is more between the groups than near A1.
So, what happened here? Why the different behavior from experiment 1b?
The E distribution that looked like the optimal B1 distribution was in reality 10 agents
with small circular distributions just like the agents in A1, but with shifted means. Let's look at the same ABM:
but this time with elipses for each agent:
We see that first the E agents interact with each other, forming smaller elipses as a result. Then the closer E agents interact with A1 agents, but the farther away E agents don't. A1 agents are pulled in direction of E, and they all finally merge in a broader elipsoid distribution in the middle. The outcome of this experiment is more random than the classical case in 1b.
Group A1 from exp. 1a (small round) interacts with group D with a distribution that looks like C in exp. 1a (large round).
Prediction: we would expect the same behavior as in the previous exp. 2: D agents reliably moves more in direction of A1.
In fact, this is not quite what happens: at the beginning it seems that the Harrington rule does not work, but then
sometimes the D distribution enlarges in direction of A1, but never moves significantly like in the previous experiment.
What happened here? Why did the asymmetric adaption effect not take place? The reason is that the individual agents of D
do not have all the same broad circular distribution as in C, but have narrow circular distribution just like A1 agents,
but placed on a large circle that looks like a large circular distribution, if you group all D agents together.
We can show this by plotting the distribution per agent as in the next repetition of experiment 4:
We see that some D agents () after some time merge with A1 agents (blue), some don't, some even merge with other D agents. The outcome of this experiment as in experiment 3 is very much random.
Lessons learned so far:
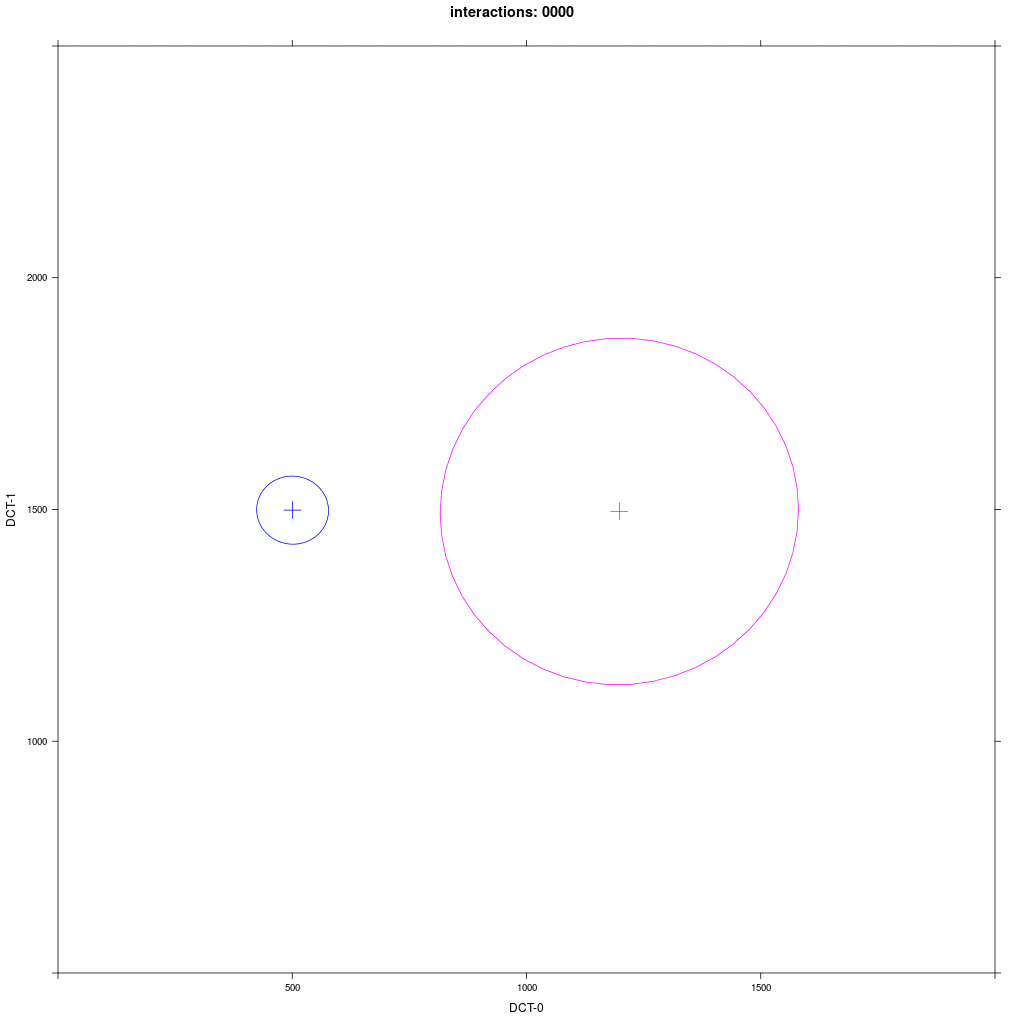
To test the last point we repeat the exp. 1a but agents in group C are twice as likely to speak than agents from A2:
Two equal-sized agent groups exchange the same phonological segment /x/ in the same word;
agents of group A2 (blue) and C (magenta) all have circular distribution with a large SD around two different means.
Agents of group C talks twice as much as agents from group A2.
Prediction: the memory tokens of A2 and C merge into a cluster near C.

q.e.d.
In this chapter we demonstrate interactions between agents initialized with synchronic production data of older and younger of British English. In synchronic production data of /u/ we observe that younger speakers have more fronted /u/ and compact feature distributions (DCT coefficients of F1 trajectories) than older speakers which show backed /u/ and wider distributions that are additionally oriented towards the distributions of the younger speakers. Because of their wider distributions we expect older speakers to adapt more in the direction of the younger speaker through interaction (/u/-fronting) than the younger speakers to move their /u/ backwards.
On this demo page we show the results of the experiment 2 in [1] (section 4) in which the criterion for agents to memorize a perceived word is determined by the Mahalanobis distance of the incoming signal to the phonological Gaussian distribution of the listener, and the time-delayed token removal strategy.
For detailed description and discussion of the experiment, please refer to [1].
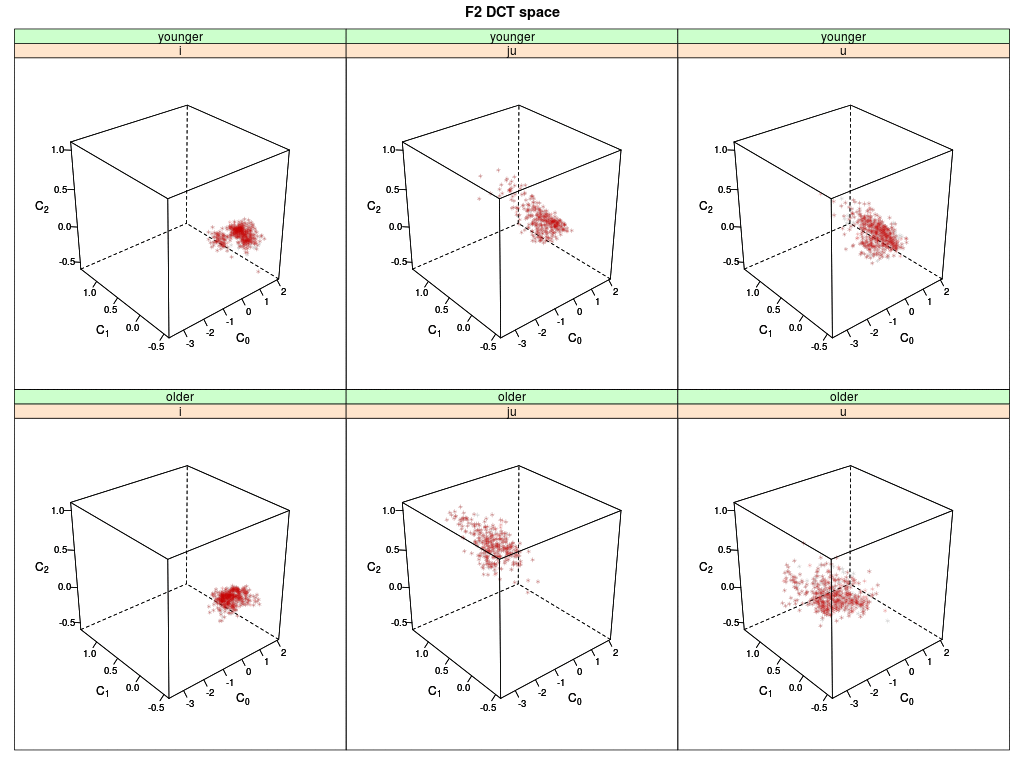
Shown are six 3-D plots of the DCT space (DCT coefficients 0-2) of the second formant F2 trajectory:
Memory data of younger speakers are shown on top, the data of older speakers below.
Each dot represents a memory token of an agent (i.e. the memorized F2 trajectory) for the
English vowels /i:/, /ju:/ and /u:/; the grey dots are the memory tokens at the begin of
the simulation; the red dots are updated memory tokens.
The simulation runs over 80000 random interactions of 11 young and 11 older agents;
each agent carries in his memory a constant set of 6 word types containing the vowels /i:/, /ju:/ and /u:/
with 10 tokens each (60 exemplars in total).
Plots are updated after 1000 random interactions; after 80000 interaction the animation starts
anew.
Watch the red dots (updated tokens) in relation to the grey (initial tokens). What you see here:
The trajectories of /i:/ (left panels) are quite compact in the initial state (grey) and remain basically stable
for both speaker group when updated through interaction (red).
The trajectories of /ju:/ for the younger speakers remain quite stable (upper mid), while for the
older speakers most updated tokens move into the area of the younger speakers' group (lower mid).
The trajectories of the /u:/ spread out a little for the younger speaker but stay in the same
location; the trajectories of the older speakers move into the area of the younger speakers
(right panels).
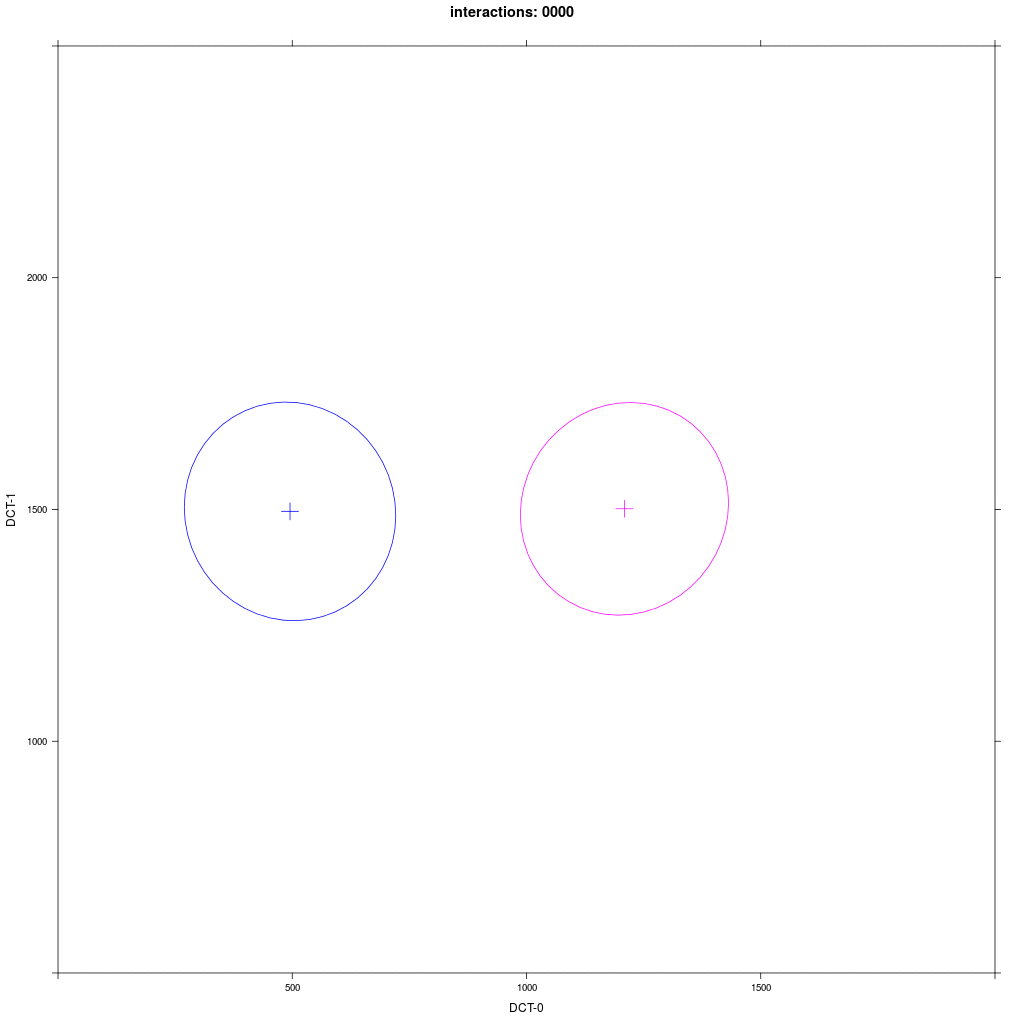
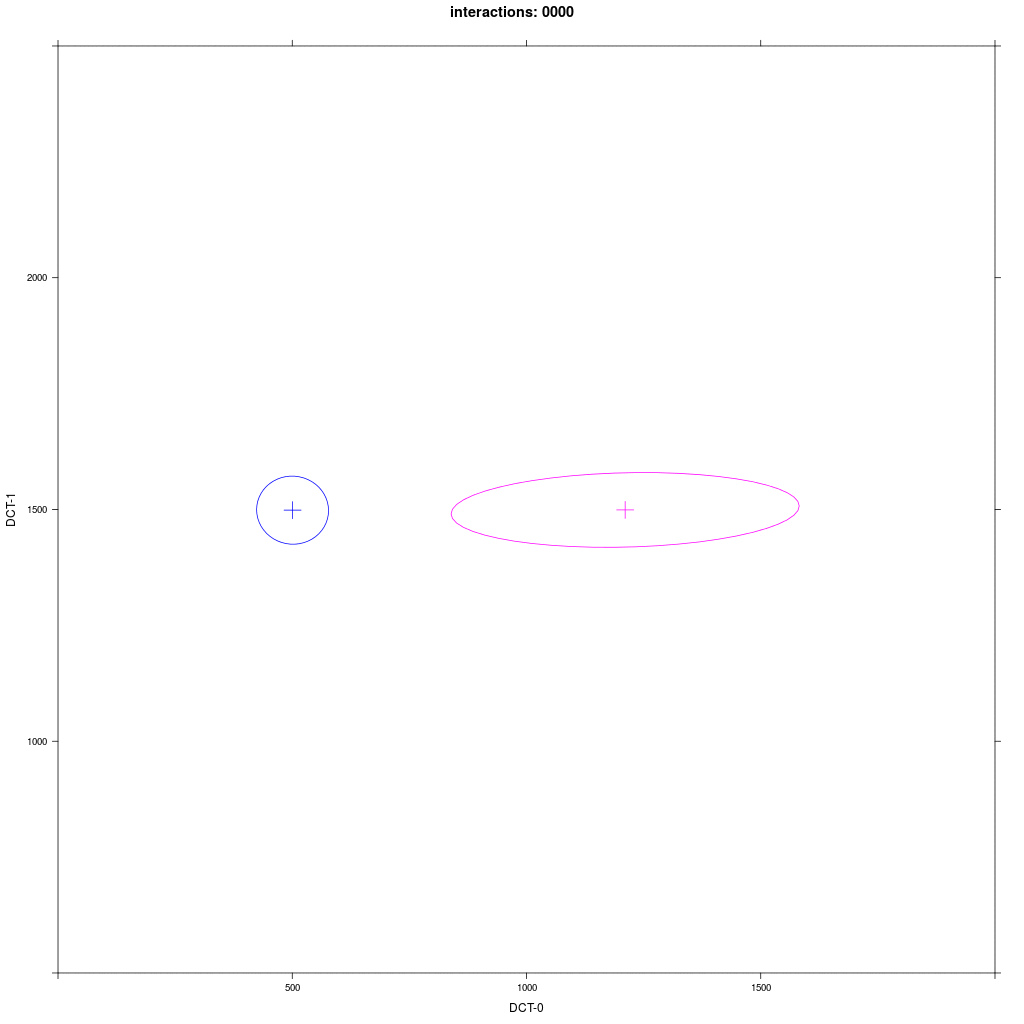
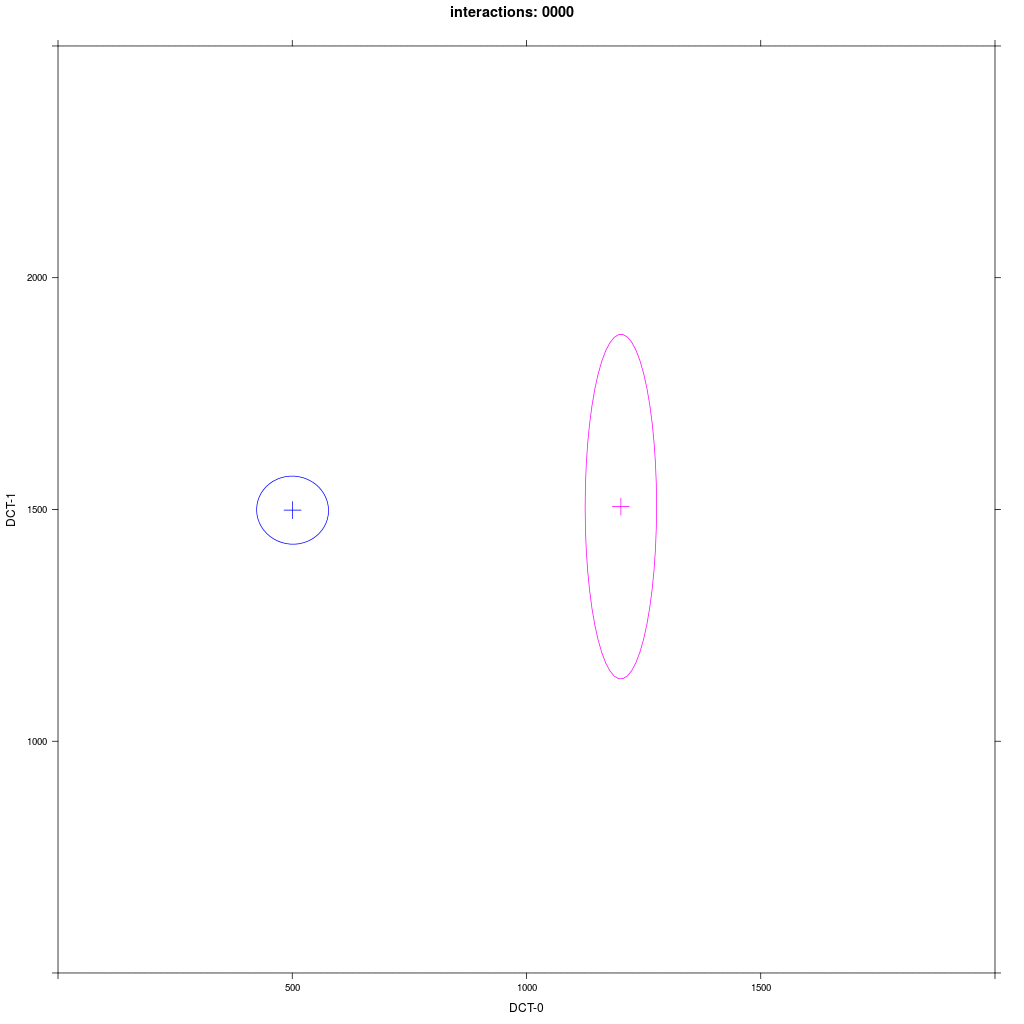
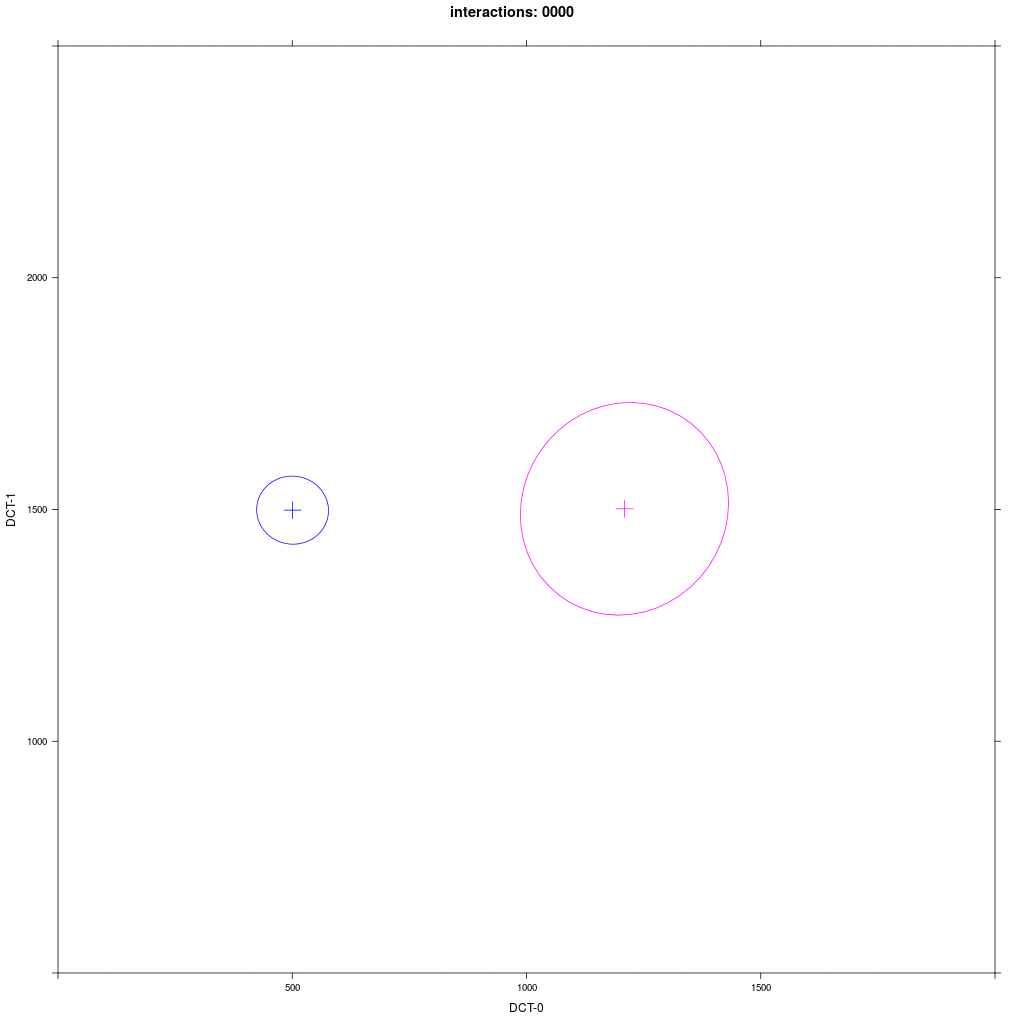
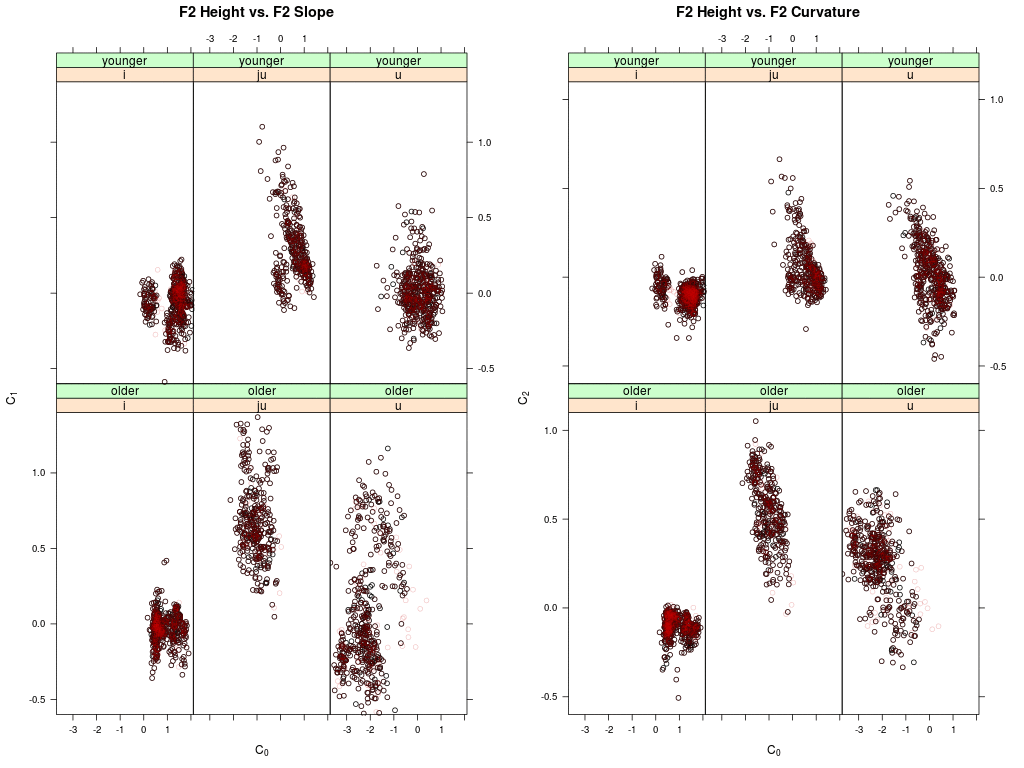
Shown are two panels: left the agent's memory distribution in the DCT-0 (height) vs.
DCT-1 (slope) plane of the second formant trajectories for the vowel /i:/, /ju:/ and /u:/;
right the same for DCT-0 (height) vs. DCT-2 (curvature).
Memory data of younger speakers are shown on top, the data of older speakers below.
Each dot represents a memory token of an agent (i.e. the memorized F2 trajectory); the
black dots are the memory tokens at the begin of the simulation; the red dots are updated
memory tokens.
In this chapter we demonstrate the effect of interactions between agents of a homogenous group initialized with synchronic productions of Australian English sibilants.
In synchronic sibilant productions we observe /s/-retraction in words like 'stream' (i.e. preceding a rhotic) compared with words like 'seam' (i.e. no rhotic), such that the sibilant is acoustically more like /esch/. All speakers show some degree of /s/-retraction in 'str' contexts, but the magnitude varies across speakers. The main hypothesis of the experiment is that interaction between agents will cause the sibilant in 'str' to shift in the direction of /esch/. The reason for this prediction is that we observe a wider and more skewed feature distribution in the /s/ sibilants (including the /s/ from 'stream' words) than in the /esch/ sibilants (whose distributions are more compact and not skewed towards /s/). Harrington's Rule as demonstrated in chapter 1 should therefore cause an asymmetric movement of the sibilant in 'str' contexts towards the /esch/, while canonical (pre-vocalic) /s/ and /esch/ should stay put. Furthermore, we predict that this asymmetric acoustic change is associated with a re-organisation of each agents' individual phonological system. More precisely, we predict that some agents will form a new sub-phonemic category for /s/ in 'stream' words that is separate from pre-vocalic /s/, and that this new sub-phonemic category may eventually merge with the /esch/ category.
In contrast with the experiment in chapter 2 ([1]), in this simulation agents are therefore able to change their phonological system depending on the distributions of the stored exemplars. They can split a category into two, or merge two categories into one if the category distributions become indistinguishable. In the animations we illustrate this by a color schema in which:
A complete sound change from /s/ to /esch/ for sibilants in 'str' would therefore start with gold and blue and result in only red (words with pre-vocalic /s/) and turquoise (words with pre-vocalic /esch/ and words with 'str' contexts). As you will see, that is not the case in the ABM simulations, but we see a tendency for change in this direction.
This is necessarily a very brief and crude summary of the study, just to outline the general idea and to make it possible to understand the following animation and figures; please refer to [2] for a detailed description.
Since we are investigating sibilants, the acoustic feature used here is the trajectory of the spectral weight M1 from onset to offset, calculated over the frequency band 500-15000Hz; sounds that are /s/-like are expected to have higher M1 trajectories than sounds that are more /esch/-like. The following plot shows the group averaged M1 trajectories for /esch/ (blue) and /s/ (green: rhotic, red: non-rhotic) in the initial synchronic data averaged over the 19 agents.

We see that the green trajectories are lower than the red - caused by the rhotic context. But the green trajectories are still far away from the lower blue /esch/ trajectories. So, there is evidence for /s/-retraction in the synchronic production data of sibilants.
As in experiment [1] we encode the M1 trajectories after speaker normalization into three Discrete Cosine Transform coefficients DCT-0, DCT-1 and DCT-2, which correspond to the height, the slope and the curvature respectively. Thus, for instance a change from high DCT-0 to low DCT-0 values means a lowering of the M1 trajectory, which in turn means a more /esch/-like sibilant. The next plot shows all agents' sibilants in the three-dimensional DCT space. Blue are the /esch/, both red and green are the /s/ sibilants (in pre-vocalic and 'str' contexts, respectively).
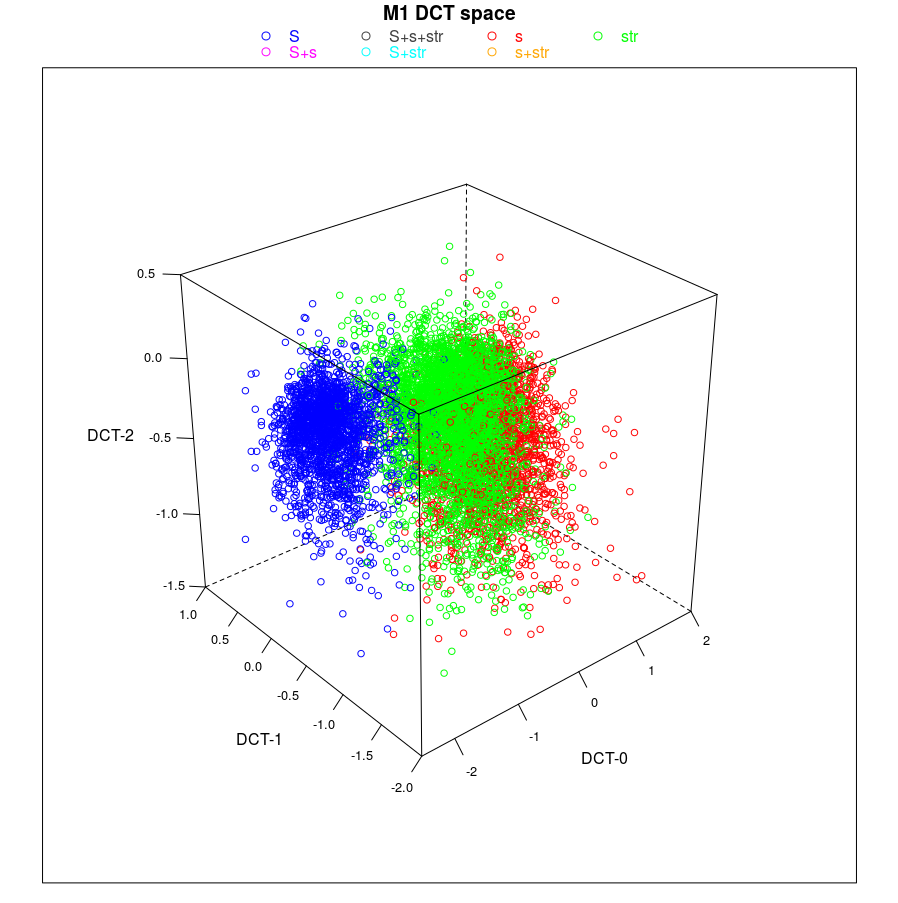
We can see that the green cloud is wider and more fuzzy than the blue cloud; this is one of the prerequisites for the Harrington Rule of asymmetric change: we would expect that - given that agents can change their phonological systems - the data in the green cloud would move more in the direction of the blue cloud than vice versa.
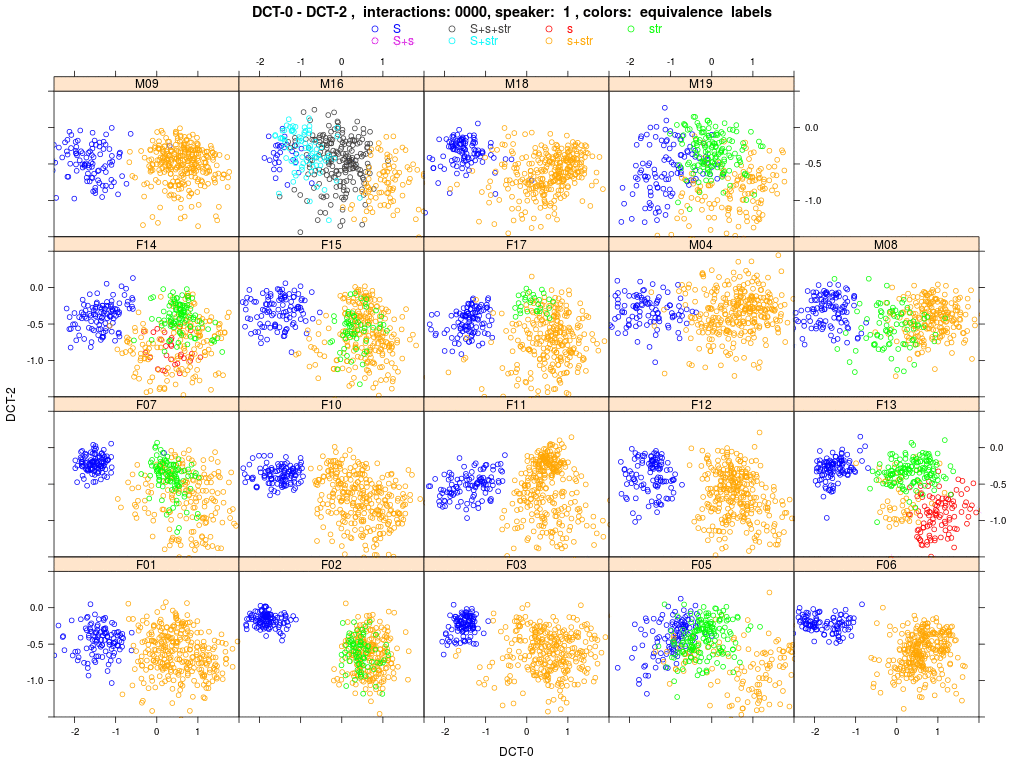
Shown are plots of all 19 agents' (females encoded with 'F..', male with 'M..') sibilant tokens in the DCT space (DCT-0 and 2). Each colored dot represents one memorized word exemplar within the agent's memory (more precisely, the sibilant within the exemplar); the agent-specific sub-phonemic class to which this exemplar is assigned is encoded by the color as outlined above. The simulation runs over 60000 random speaker-listener interactions; each agent carries in his memory a constant set of 41 word types with 10 tokens each (410 tokens in total). Plots are updated after each 1000 interactions; after 60000 interactions the animation starts anew (see 'interactions: ####' in the header of the animation).
At the start of the simulation (interactions: 0000) you'll see that agents already have individual sets of sub-phonemic categories (different color groups). These were derived from the production data recorded for individual speakers and stored in the agents' memories prior to any interaction. The agent-specific colour schemes come about because we applied the basic rules for splitting and merging categories before agents interacted. Notice that agent M16 is a very strong 's-retractor', therefore he already shows a (green) str category that has split from the initial (gold) s+str category, and then it turns out that the exemplars in this new (green) str are acoustically so close to the exemplars of the (blue) S category that they then merge (partially) into a (turquoise) S+str.
M16 is surely an extreme case; a more typical case would be F17: she starts with the classic blue S and gold s+str. Then after a few thousand interactions you'll see that some gold tokens split off into green str and red s. The green and red clouds grow while the gold cloud shrinks, i.e. more and more /s/ words are assigned to classes that contain only str words. And very, very slowly the green cloud moves in the direction of the blue cloud, while the blue cloud stays put. But F17 never develops a turquoise cloud S+str, i.e. 'str' words never merge with /esch/ (which we would consider as evidence of a completed sound change). Other agents do: watch for instance F05 or M19. But for the majority of agents, interaction causes the gold s+str category to split into s and str.
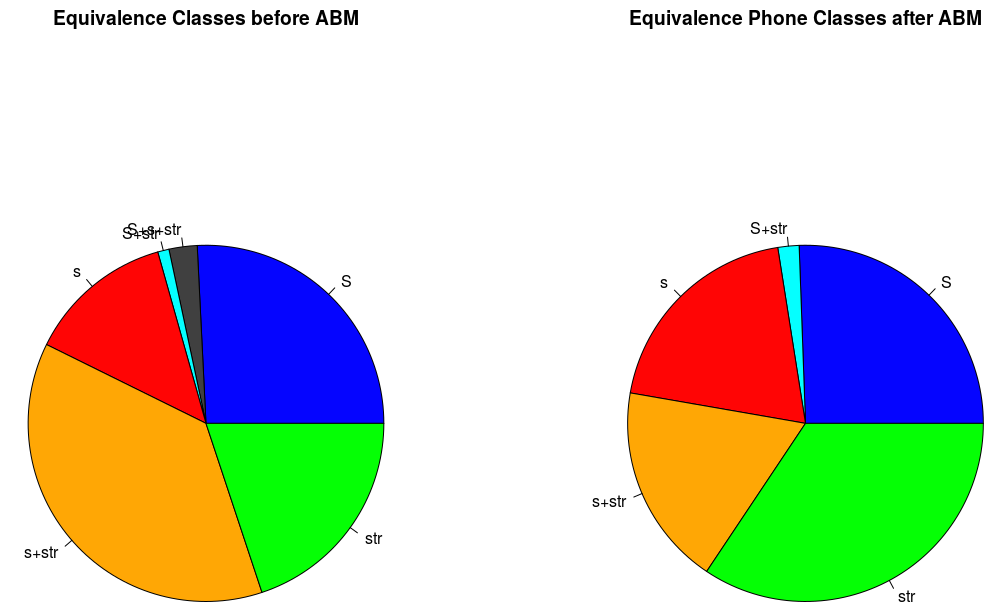
The following pie charts show the proportions of sub-phonemic classes in agents' memories before (left) and after (right) 30000 interactions. The classical /s/ category s+str (gold) shrank, while both the green str and the red s increased; the proportion of the merged turquoise S+str, which would be the end of the envisaged sound change, doubled in size.
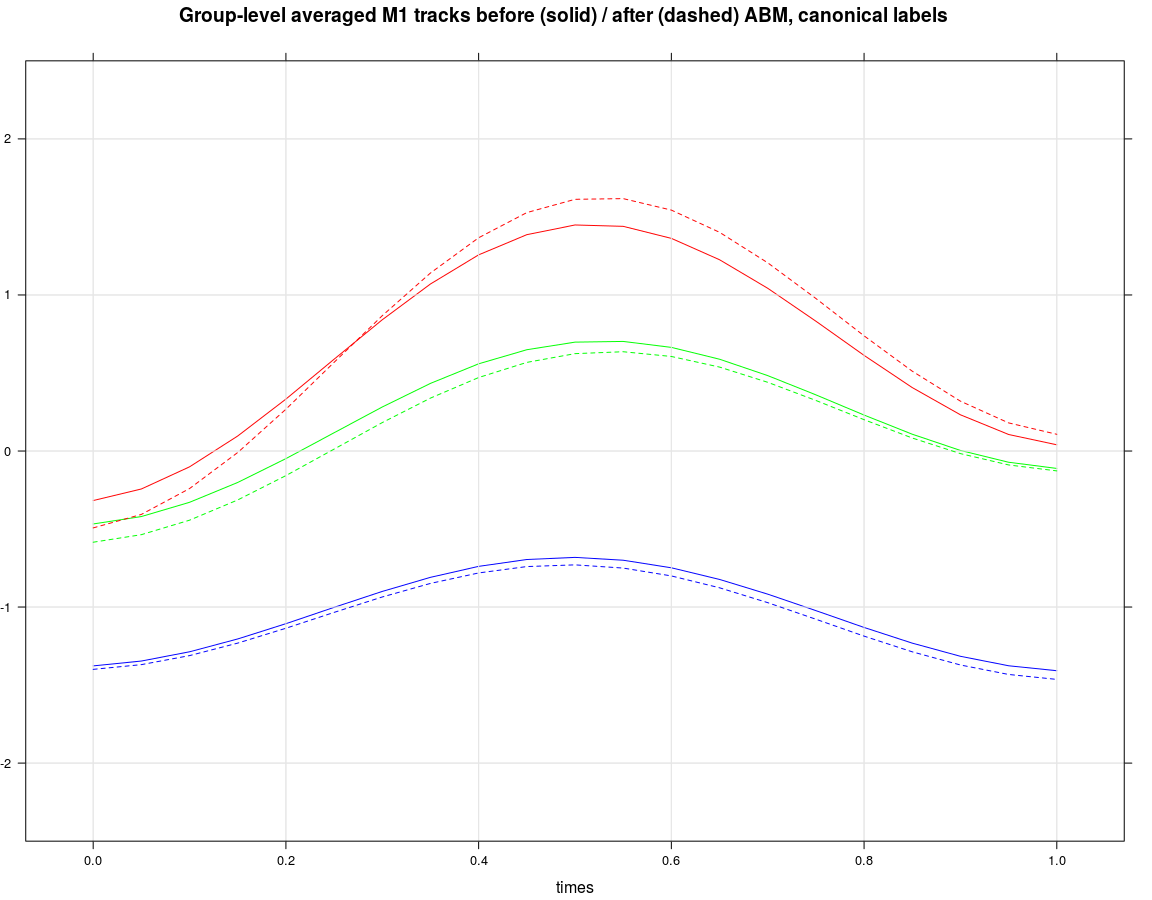
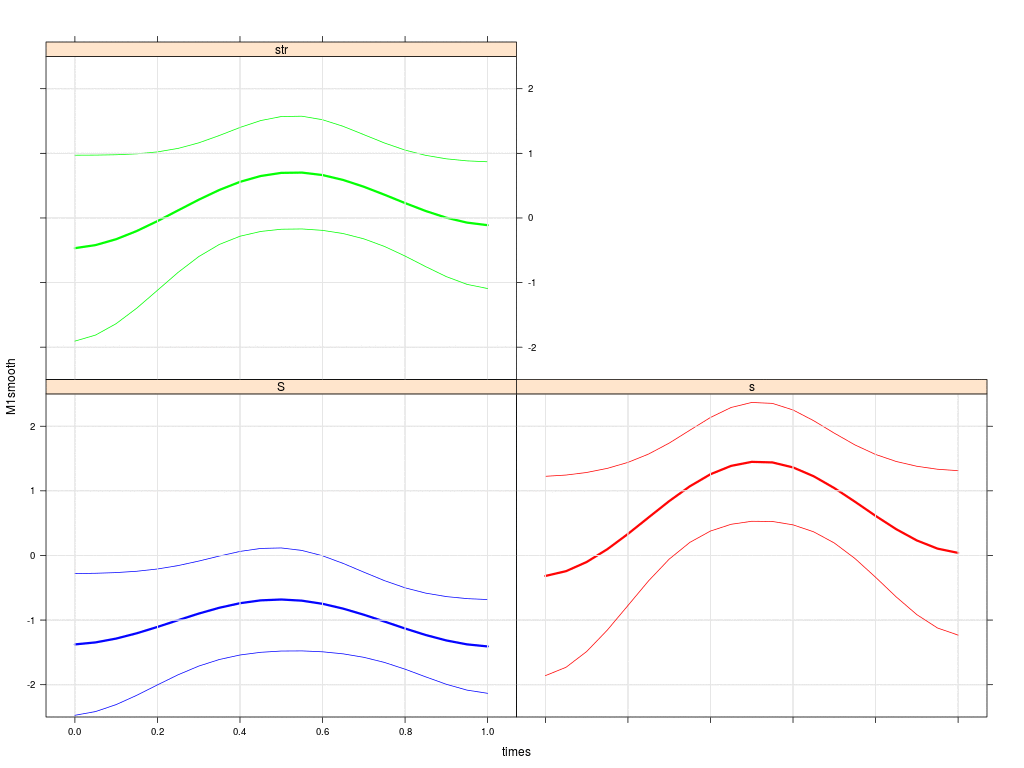
The next plot shows the group averaged M1 trajectories of /esch/ (blue), /s/ in 'str' words (green) and /s/ in pre-vocalic contexts (red). Solid is the initial state; dashed is the state after 30000 interactions; thin lines in the animation (next plot) below and above the thick mean trajectory indicate the standard deviation of agents' trajectories. We see that the green trajectory moves down, while the red trajectory moves up.
The simulations show a change in agents' phonological systems such that /s/ splits into two separate categories, one comprising words with /s/ in pre-vocalic contexts and the other comprising words with /s/ in 'str' contexts. However, it only rarely happens that the 'str' words merge with the /esch/ category.
The simulations also show that the M1 trajectories for /s/ in 'str' are lowered in the direction of the /esch/ trajectory, while the remaining /s/ (red) trajectories stay put or even rise. There is thus support for the idea that interaction promotes movement of the group's /s/ in 'str' in the direction of the sound change that has been observed in other varieties of English.
[1] Harrington J, Schiel F (2017): /u/-fronting and agent-based modelling - The relationship between the origin and spread of sound change. Language, Vol 93, No 2 (2017), pp. 414-445, doi:10.1353/lan.2017.0019.
[2] Stevens, M., Harrington, J. and F. Schiel (forthcoming) Associating the origin and spread of sound change using agent-based modelling applied to /s/-retraction in English', GLOSSA.